Analytics
Dybee
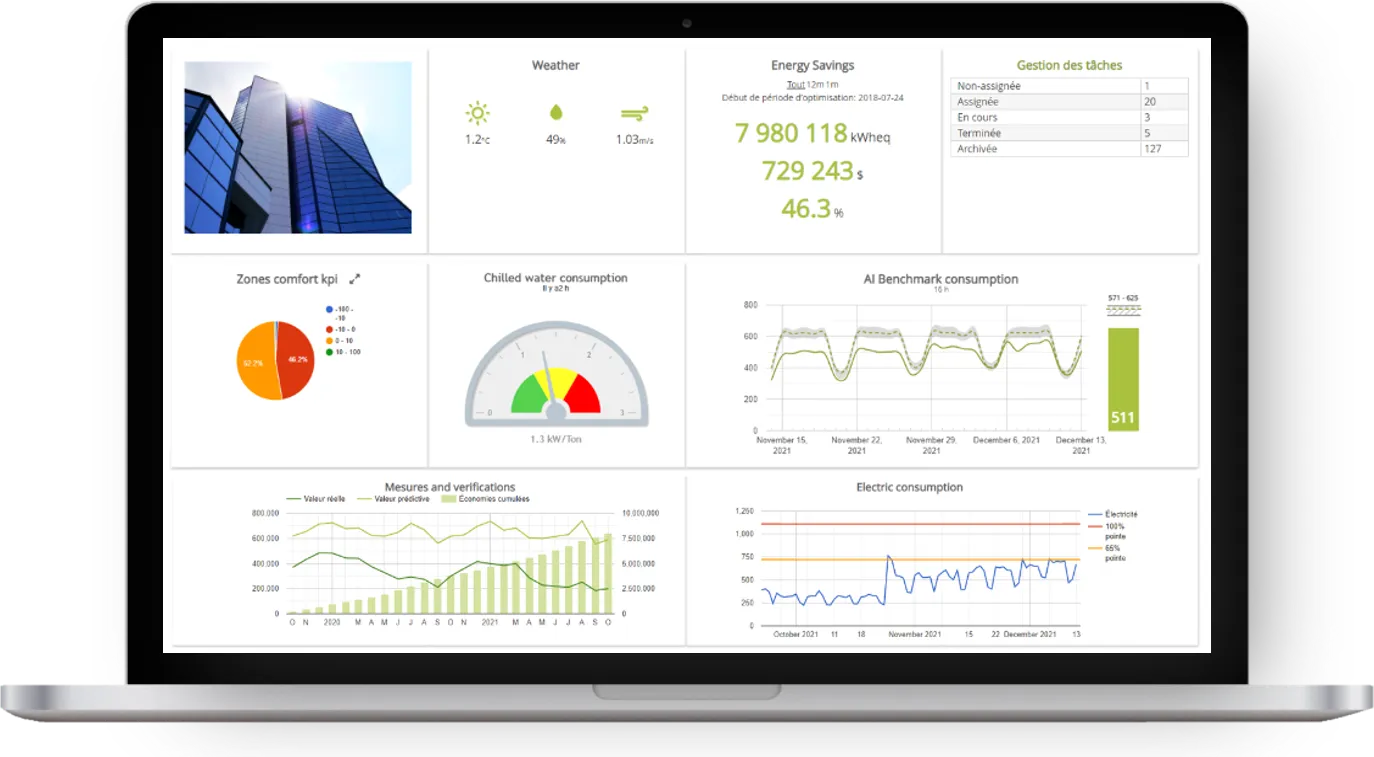
Dybee combines energy data and operational data to optimize overall performance. It is a web platform available from anywhere, for your teams as well as the external stakeholders working to improve your site.
It lets you configure acquisition, then label, model and enrich your data to generate diagnostics, indicators and maintenance tasks.
- EMIS
- ISO 50001
- RCx
- CxC
- MBCx
Highlights
- Energy and operations
A single view to optimize overall performance.
- EMIS · ISO 50001
Your ally for any energy efficiency project, such as an RCx or an ISO 50001 certification.
- Advanced diagnostics
Peak demand management, fault detection, performance indicators and AI models.
- Tasks and documentation
Close tracking of your energy efficiency projects and a knowledge base for your site.
Features
 01
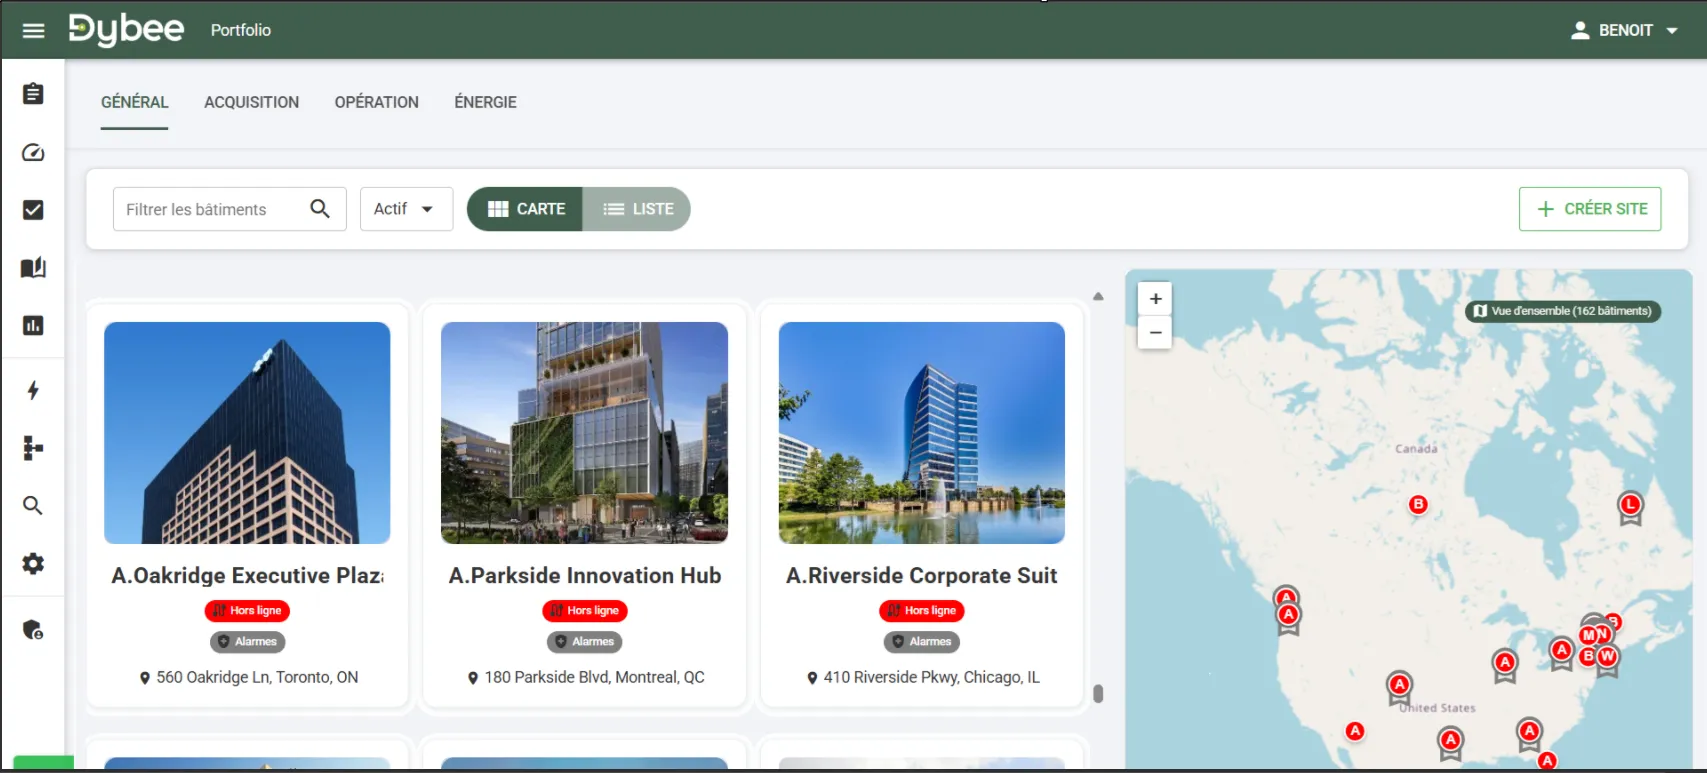
Portfolio
All your sites at a glance: complete tracking of operations, energy and consumption, in one place.
 02
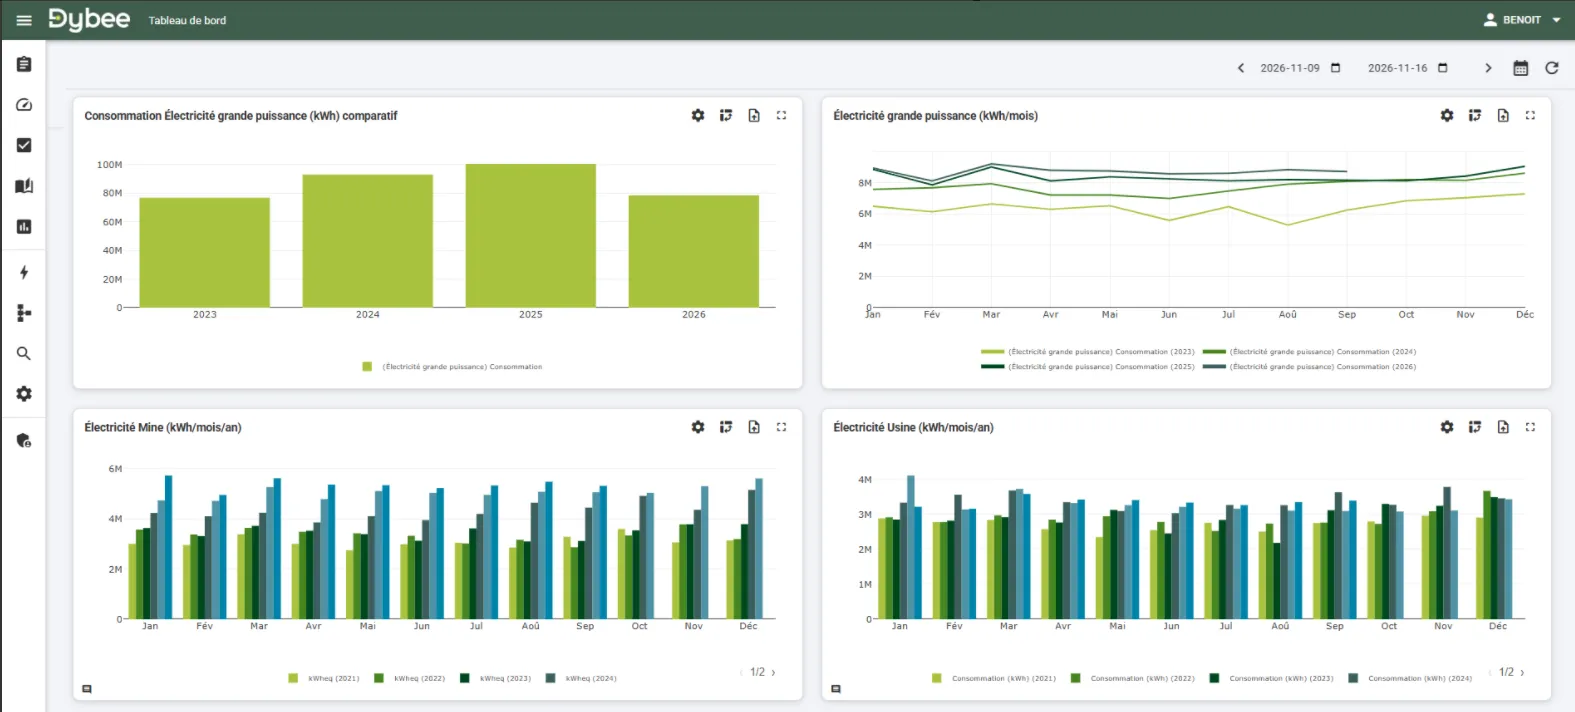
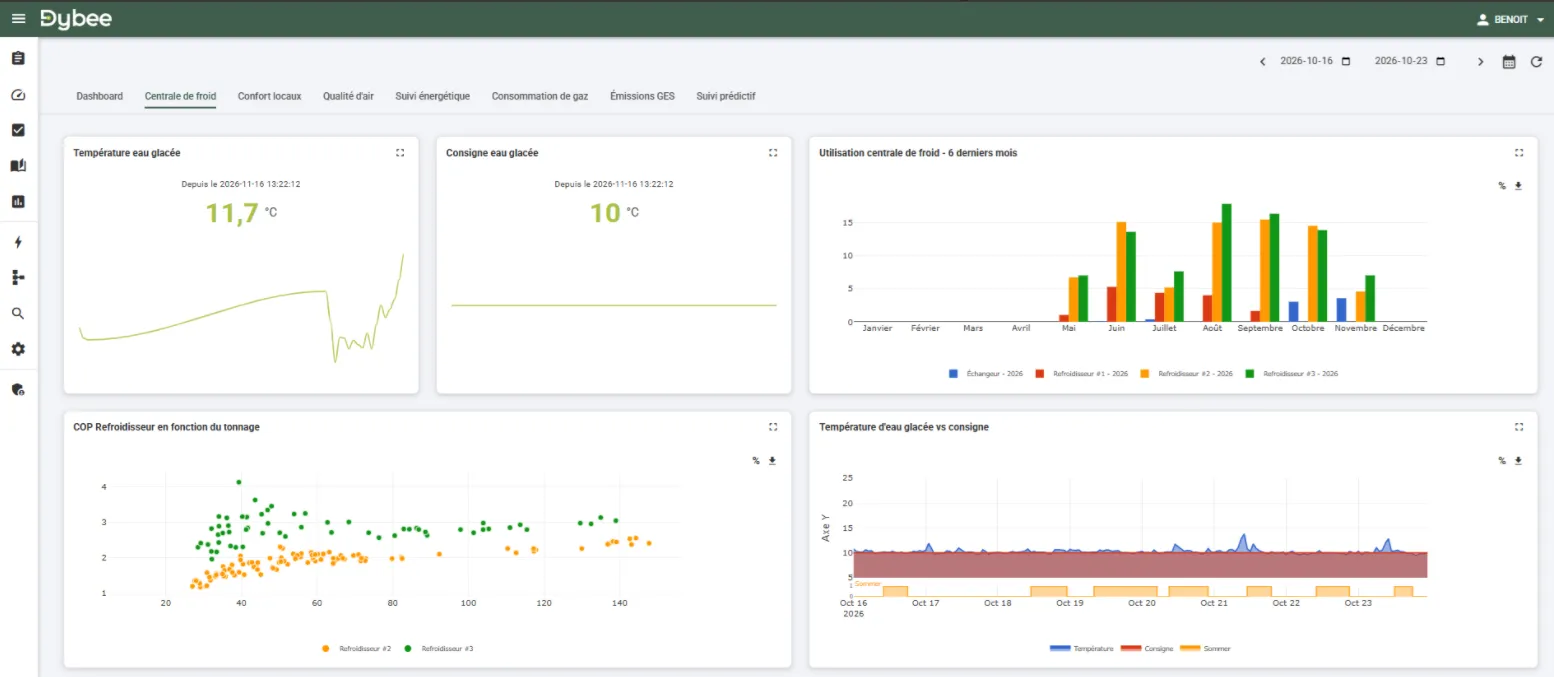
Dashboards
Your key indicators, results and reports brought together in clear views, so technicians, analysts and managers move in the same direction.
 03
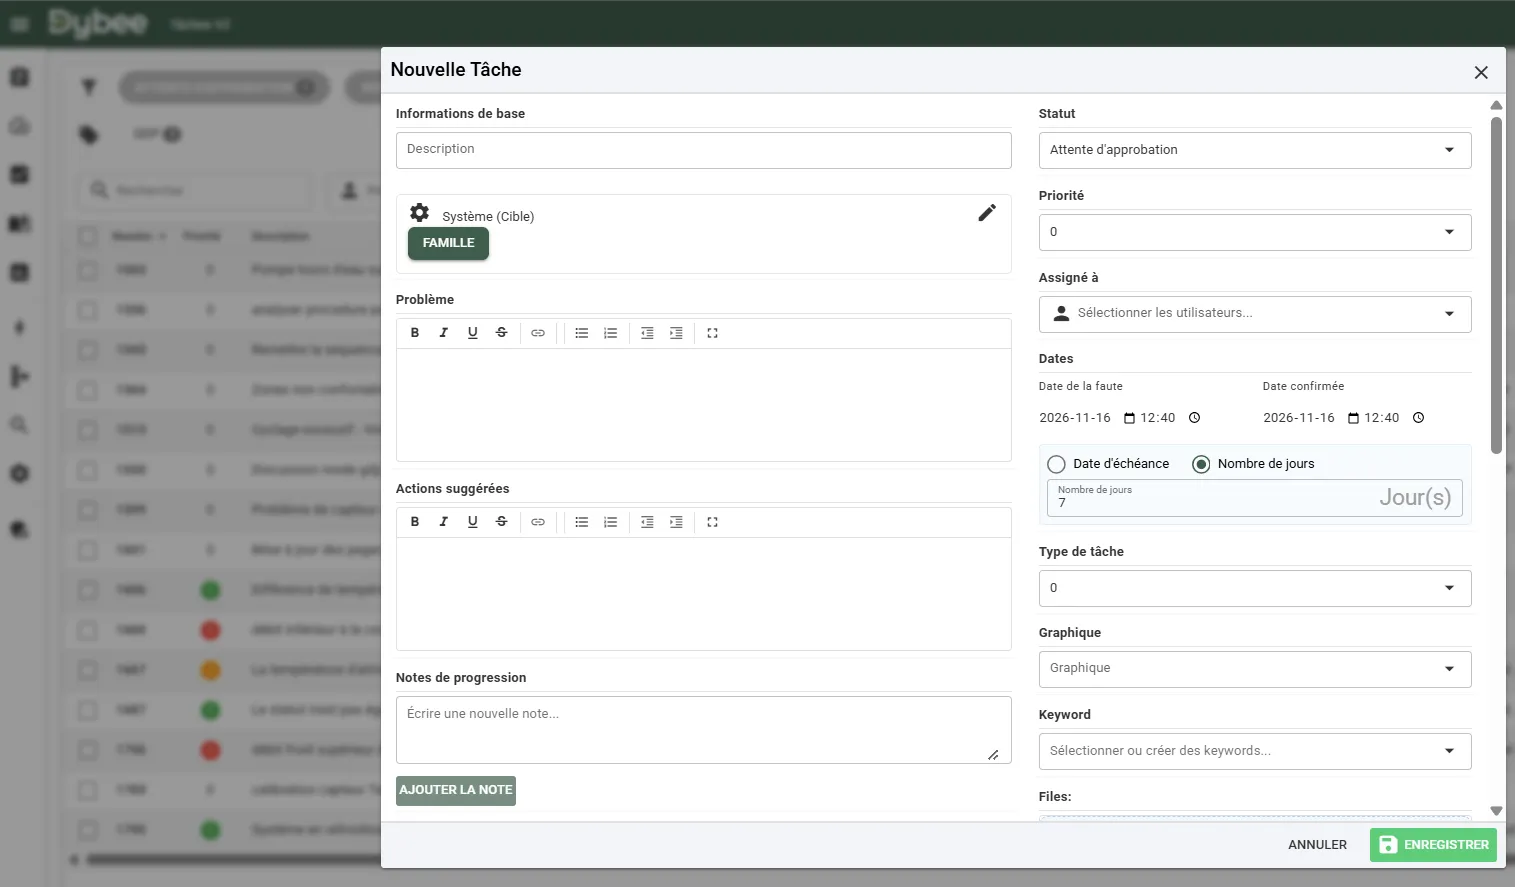
Task management
Diagnostics become maintenance and improvement tasks, tracked until they are resolved.
 04
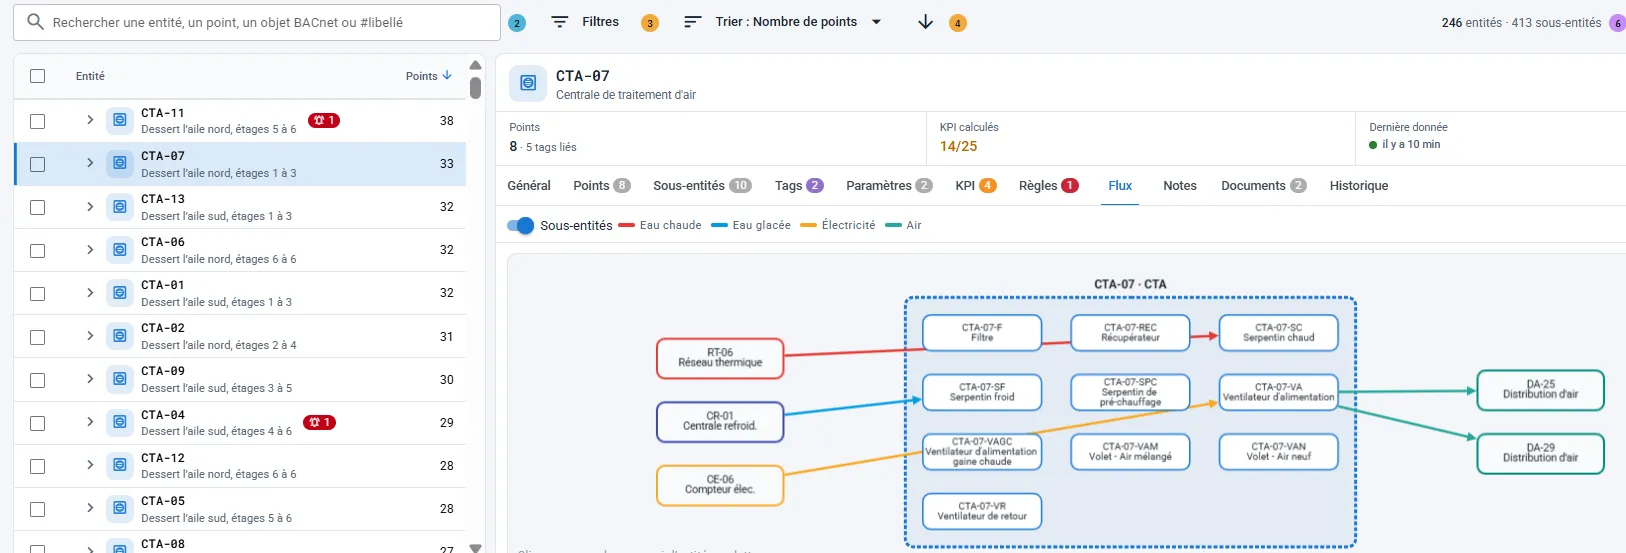
Modeling
Your equipment and systems, data structure, energy flows, images, documents, notes and comments: a complete picture of the site, so your teams understand it and Dybee’s intelligence can analyze it automatically.
 05
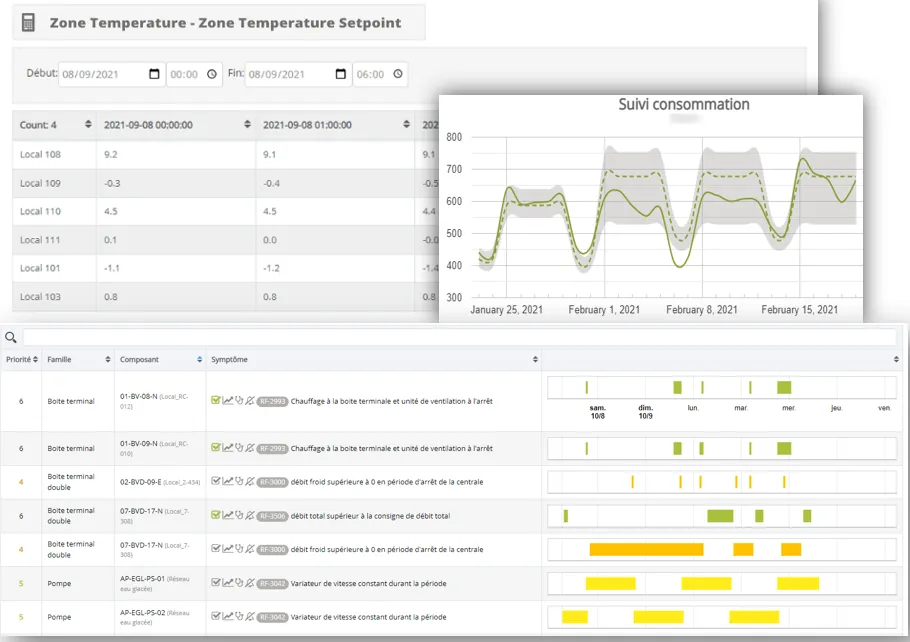
Fault detection reports
Clear reports on detected faults and the actions to take, ready to share with your teams and partners.
 06
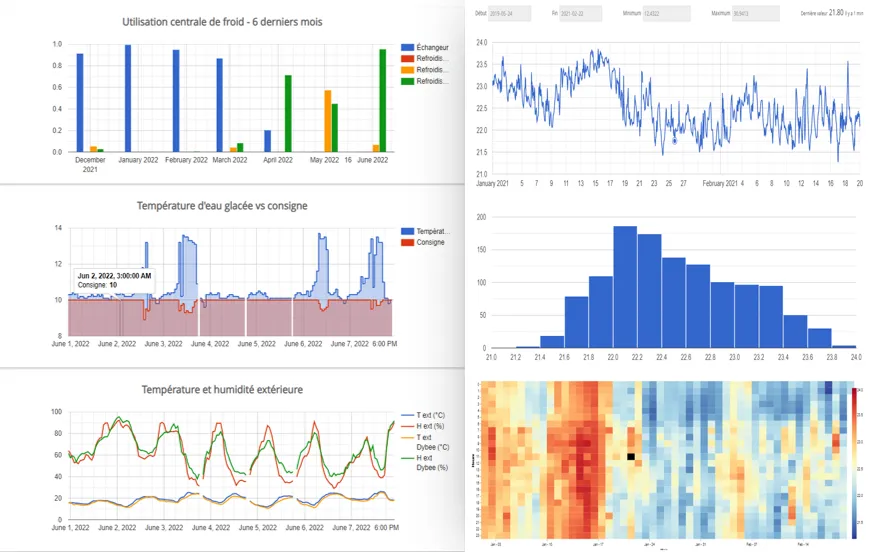
Charting tool
Explore your data: overlay trends, compare periods and quickly spot anomalies.
 07
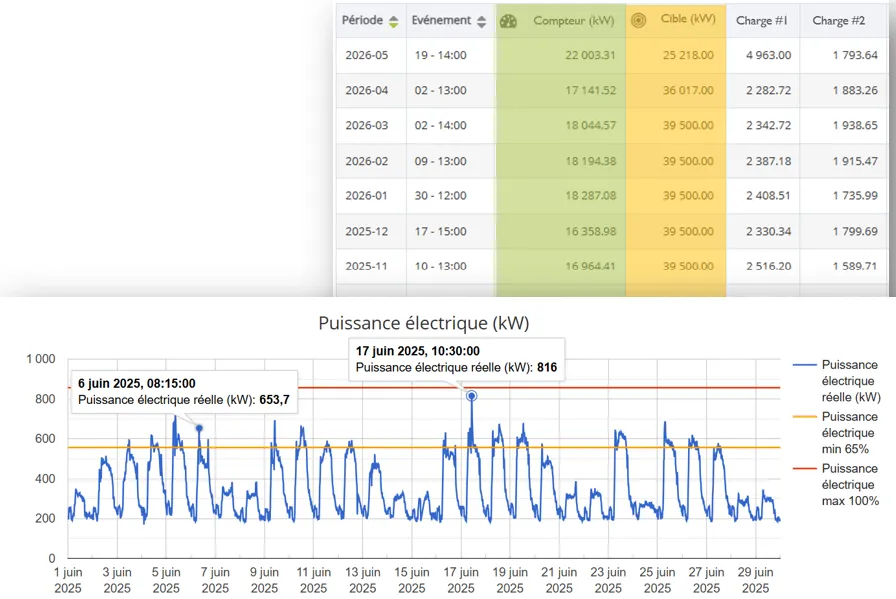
Analysis modules
Machine learning models, schedule tracking, peak demand analysis and other specialized modules to take your analyses further.
 08
Fault detection and calculations
Dybee provides a library of fault detection rules, algorithms and performance indicators. You can also add your own rules and calculations.